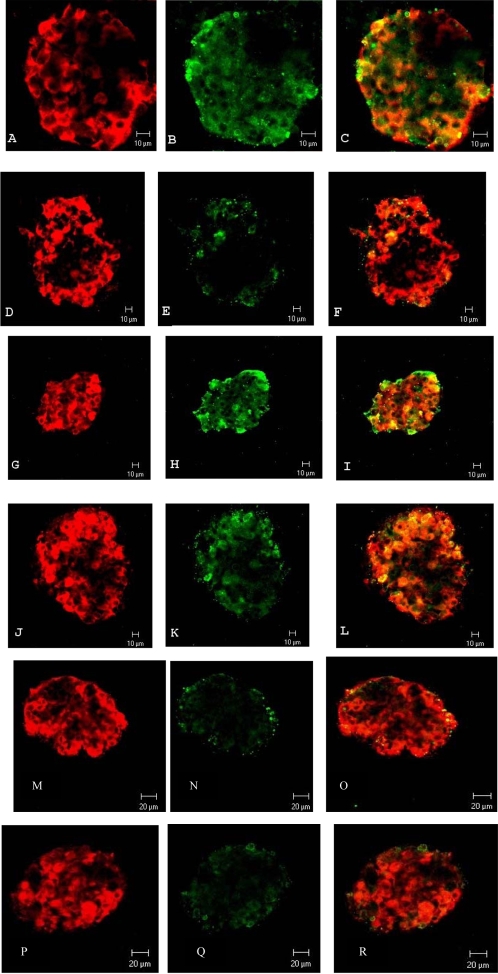
Figure 3. Confocal microscopy of incubated islets from the GK rat.
Isolated islets were incubated for 90 min in the presence of; A, B and C) 3.3 mmol/l glucose; D, E and F) 3.3 mmol/l glucose+100 nmol/l GLP-1; G, H and I) 3.3 mmol/l glucose+100 nmol/l GLP-1+2 µmol/l H-89; J, K and L) 3.3 mmol/l glucose+2 µmol/l H-89; M, N and O) 3.3 mmol/l glucose+100 nmol/l GLP-1+10 µmol/l MG 132; P, Q and R) 3.3 mmol/l glucose+10 µmol/l MG 132. After incubation the islets were double immunolabeled for insulin and iNOS and analysed by confocal microscopy. Insulin and iNOS stainings appear, respectively, as red (A, D, G, J, M and P) and green (B, E, H, K, N and Q) fluorescence. Co-localisation of insulin/iNOS is seen as a orange-yellowish fluorescence (C, F, I, L, O and R). Plates S-U shows Wistar control islets at 3.3 mmol/l glucose. No iNOS expression could be detected (T). Bars indicate lengths (10 µm).

