Figure 2.

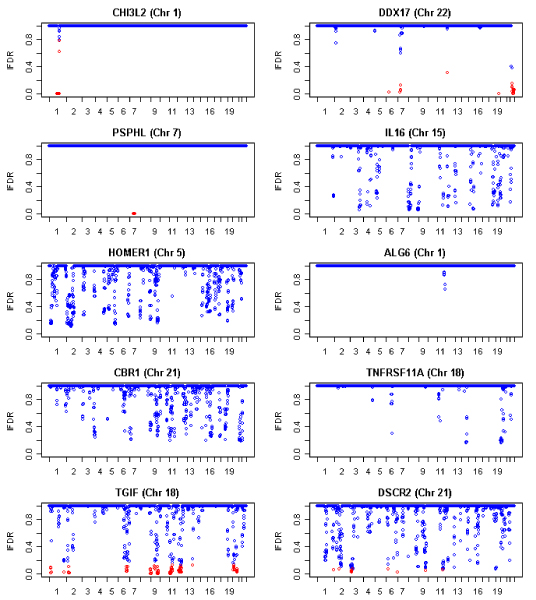
Estimated posterior probabilities (lFDR) for the 10 selected genes along the 22 chromosomes. Significant results at FDR threshold 0.05 are plotted in red.

Estimated posterior probabilities (lFDR) for the 10 selected genes along the 22 chromosomes. Significant results at FDR threshold 0.05 are plotted in red.