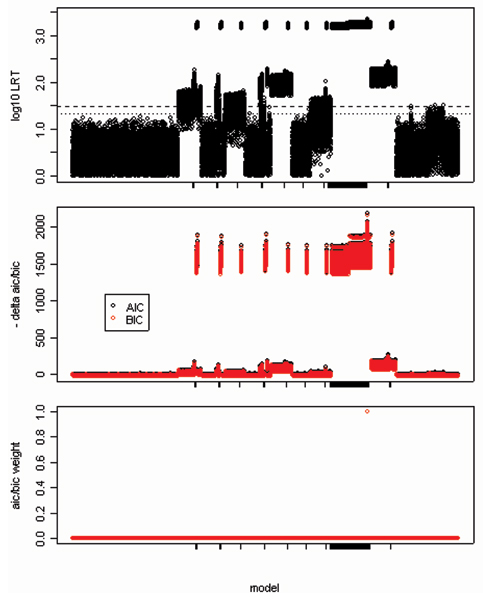
Figure 1.
Log10 LRT, ΔAIC/ΔBIC, and AIC/BIC weights. Log10 LRT (top), ΔAIC, ΔBIC (middle), and AIC and BIC weights (bottom) for all 436 models over all 100 replicates, sorted alphabetically (by SNP1 and SNP2) from left to right of the x-axis (from left to right: the null model, the model with denseSNP6_11568 alone, the model with denseSNP6_11568 and denseSNP6_11596,..., the model with SNPs denseSNP6_3437 and denseSNP6_3476). Models containing either s3426 or s3436 are indicated by tick marks on the x-axis. The models containing denseSNP6_3426 and denseSNP6_3436 showed the largest LRT and -ΔAIC (ΔBIC). The dashed line in the top figure is the Bonferroni-corrected genome-wide significance threshold for a chi-squared test with 3 d.f., and the dotted line is the study-wide significance threshold.

