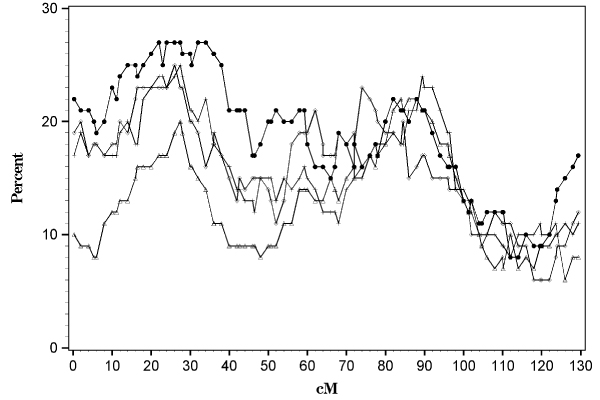
Figure 1.

Mean test for linkage on chromosome 16 using various subsets of ASPs. The percent of significant results (at α = 0.05) is plotted against the centimorgan (cM) location. Solid circles represent the entire data set, while the plus signs, diamonds, and triangles represent those ASPs in which π at the DR locus was greater than 0.5, 0.7, and 0.9, respectively.
