Figure 1.

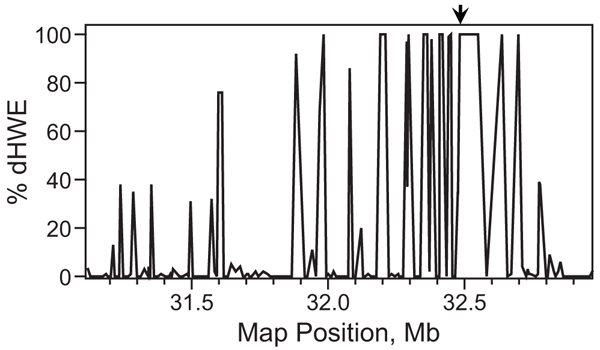
Deviation from HWE in the neighborhood ofHLA-DRB1. The χ2 test for HWE was applied to samples from 100 replicates; the percentage of replicates in which p < 0.001 is shown for 170 consecutive markers near HLA-DRB1 (arrow).

Deviation from HWE in the neighborhood ofHLA-DRB1. The χ2 test for HWE was applied to samples from 100 replicates; the percentage of replicates in which p < 0.001 is shown for 170 consecutive markers near HLA-DRB1 (arrow).