
Figure 2.
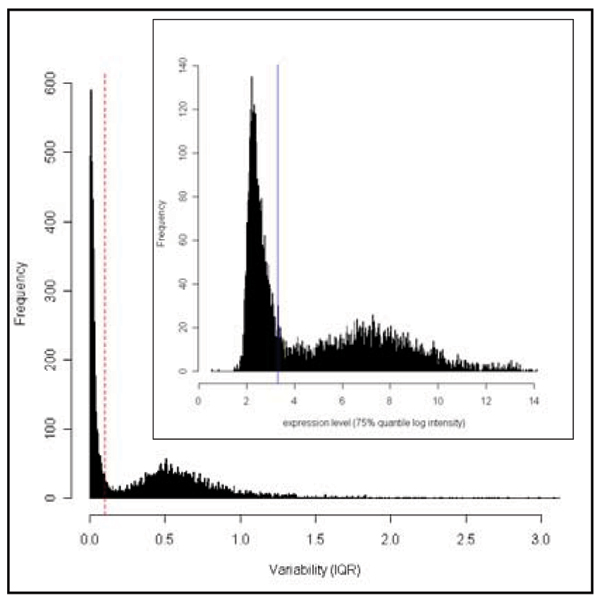
Variability and expression level of expression traits. Frequency distribution of the IQR of transcripts. The red dashed line indicates IQR of 0.1. The inserted histogram shows the expression level, as measured by the 75% quantile of each expression trait. All of the expression traits with IQR under 0.1 are found to be also lowly expressed, with the maximum expression level of 3.3 in log intensity (as indicated by the blue line).