Figure 4.

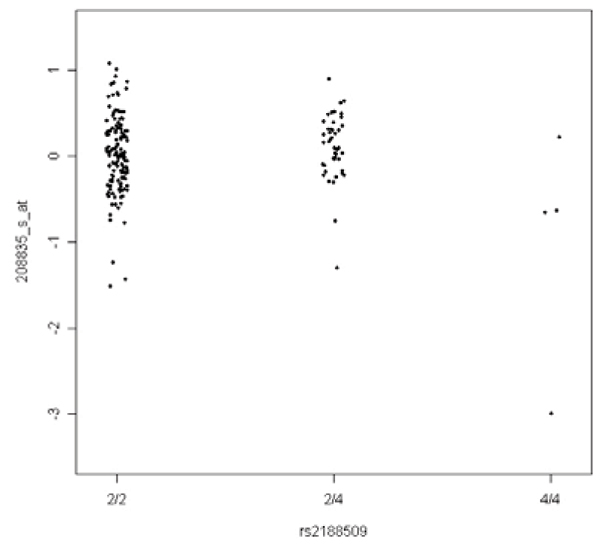
Scatter plot of the expression trait residuals of probeset 208835_s_at after Step 1. Spurious p-value of 2.6 × 10⁻⁵ is caused by an outlier in genotype class 4/4.

Scatter plot of the expression trait residuals of probeset 208835_s_at after Step 1. Spurious p-value of 2.6 × 10⁻⁵ is caused by an outlier in genotype class 4/4.