
Figure 1.
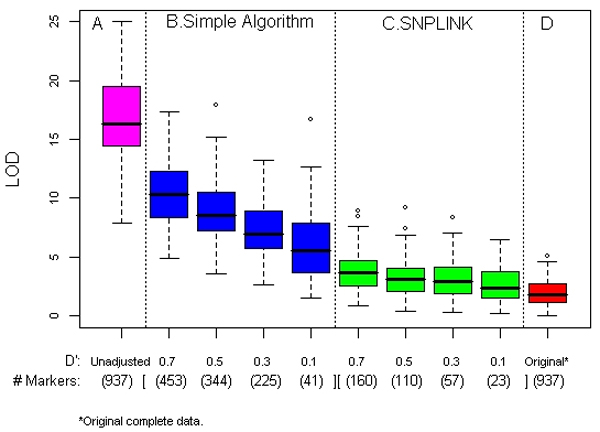
ASP analysis: average maximum LOD score and average number of markers (D'). Summary results from all 100 replicates with families without parental genotypes (except for the last panel, which shows the results from the complete data with full parental genotypes). Maximum LOD scores are shown in box plots with four panels: A, unadjusted, data with missing parental genotypes (pink); B, simple algorithm, with four D' thresholds (blue); C, SNPLINK, with four D' thresholds (green); and D, complete data unadjusted (red).