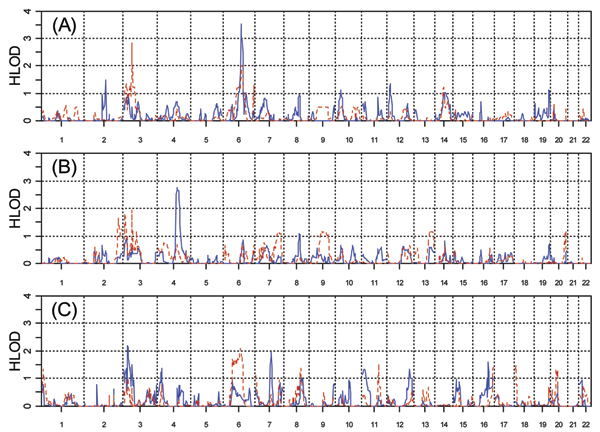
Figure 2.
Genome-wide HLOD statistics. A, FULL analysis model; B, HIGH model; C, LOW (protective) model. The solid line represents the dominant inheritance model and the broken line represents the recessive model in each figure. HLOD values are shown on the vertical axis, and chromosome number is shown on the horizontal axis.

