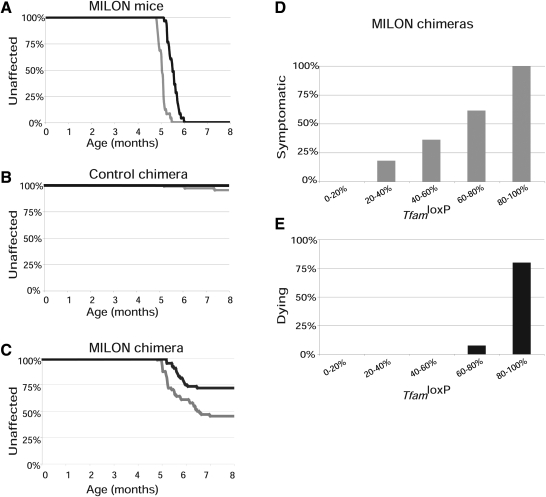
Figure 4.
Observation of clinical symptoms and determination of lifespan in chimeras. Age at onset of symptoms was scored by a clinical assessment scale and is indicated by gray lines. Age at death (or age at onset grave symptoms requiring euthanasia) was determined and is indicated by black lines. (A) Symptoms and survival in pure mitochondrial late-onset neurodegeneration (MILON) mice (n = 25). (B) Symptoms and survival in control chimeras (n = 57). (C) Symptoms and survival in MILON chimeras (n = 63). (D) Relationship between grade of chimerism and occurrence of symptoms in MILON chimeras. (E) Relationship between grade of chimerism and occurrence of death in MILON chimeras.

