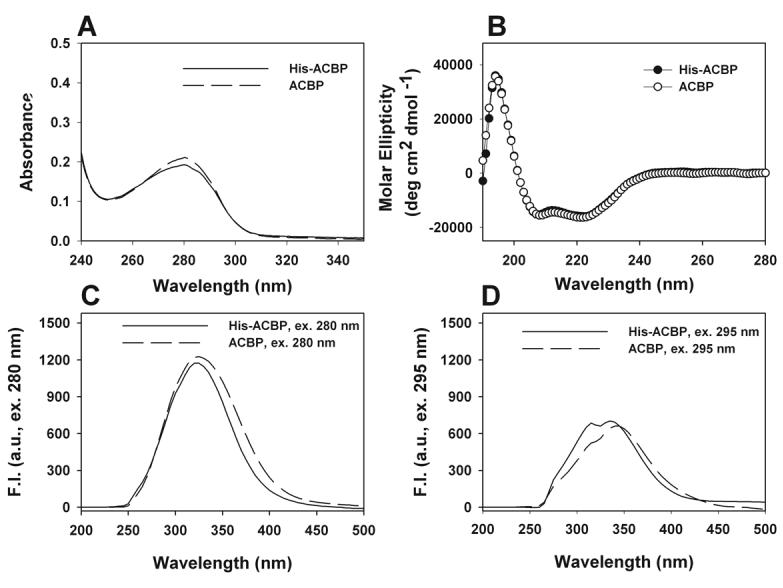
Figure 2. Structural characteristics of his-ACBP vs untagged ACBP: UV absorbance, CD and fluorescence spectra.

A. UV-Vis spectra of 5μM his-ACBP (solid) and 5μM untagged ACBP (dashed). B. Far UV CD spectra of his-tagged ACBP (solid) and ACBP (open). All CD studies were performed with 4μM protein. C. Fluorescence emission spectra of 200nM his-ACBP (solid) and 200nM ACBP (dashed) with excitation at 280 nm. D. Fluorescence emission spectra of 200nM his-ACBP (solid) and 200nM ACBP (dashed) with excitation at 295 nm.
