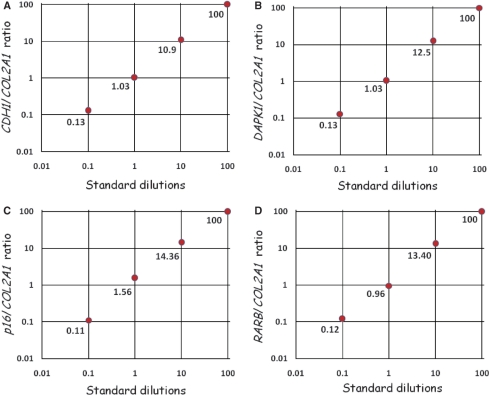
Figure 4.
The quantitative accuracy of the SMART-MSP assays. The quantitative accuracy of the SMART-MSP technology was assessed using the 2(−ΔΔCT) quantification approach. For each assay the calculated gene/control ratio for each standard is plotted against the dilution factor in a double logarithmic diagram. All assays proved to be quantitatively precise. (A) The CDH1 assay. (B) The DAPK1 assay. (C) The CDKN2A assay. (D) The RARB assay.

