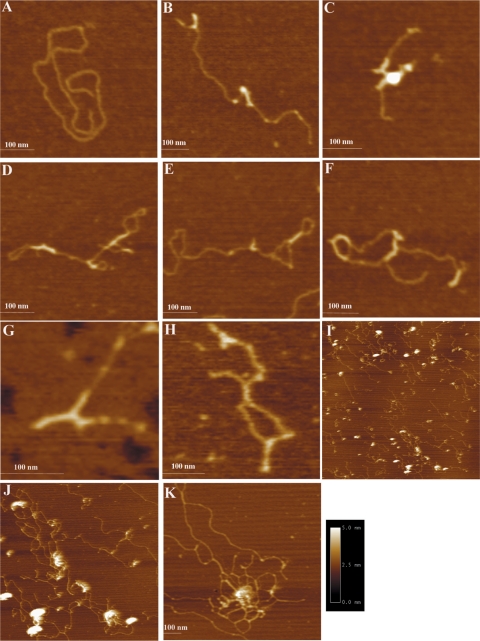
Figure 4.
AFM images of protein–DNA complexes formed by Lsr2 and linear DNA. (A) Linear pMPS in the absence of Lsr2 protein. (B)–(F): Lsr2–pMPS complexes at low protein/DNA ratios (1 dimer per 260 bp). (G) and (H): Lsr2–pDrive complexes at low protein/DNA ratios (1 dimer per 260 bp). (I)–(K): Lsr2–pDrive complexes at high protein/DNA ratios (1 dimer per 65 bp). The dimension for (I) is 5 µm × 5 µm and for (J) is 2 µm × 2 µm. The same color scale ranging from 0.0 to 5.0 nm (from dark to bright) was used for all images.

