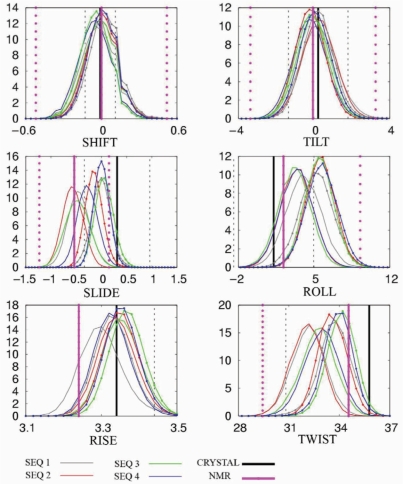
Figure 2.
Distribution of base pair step helical parameters averaged, for each snapshot, over the central 16-bp portion of each sequence. Translational parameters are in angstroms and rotational parameters in degrees. Values for parmbsc0 simulations are represented by lines; CHARMM27 values correspond to lines with points. For comparison, sequence-dependent average values based on crystal data (black) and values averaged over all available nmr data (magenta) are shown as straight vertical lines with 1 SD confidence intervals (dotted lines). Histograms were constructed using 50 bins between the maximum and minimum values for each parameter.

