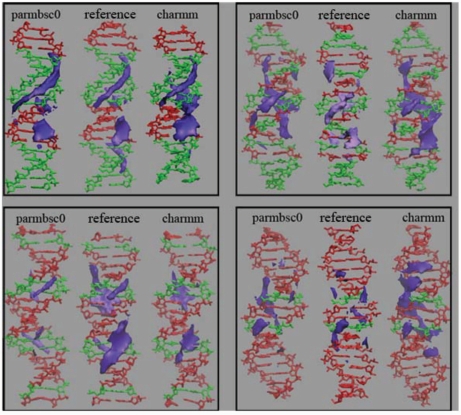
Figure 4.
Classical interaction potential (CMIP, in purple) of average parmbsc0 and CHARMM27 DNA conformations. Grid was constructed with a 0.5-Å spacing. The contour shown corresponds to −5 kcal/mol level. CMIP distributions obtained for idealized conformations built by using sequence-dependent average base pair step parameters from the X-ray ensemble are shown as reference. SEQ1: top left, SEQ2: top right, SEQ3: bottom left, SEQ4: bottom right.

