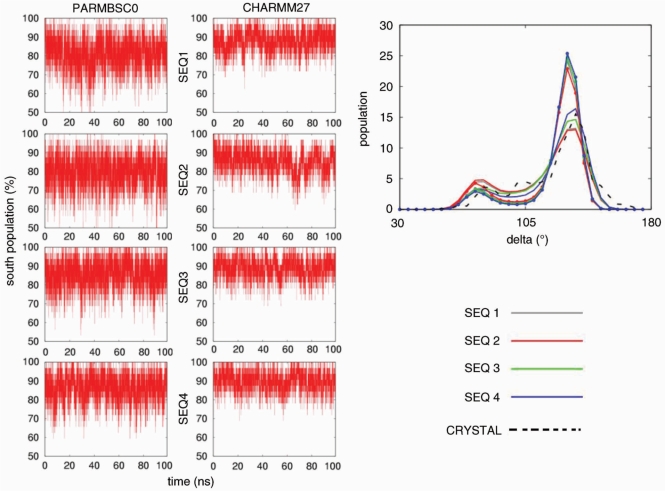
Figure 6.
Left: population (in percentage) of nucleotides with South puckering for the four oligonucleotides in parmbsc0 and CHARMM27 simulations. Right: histogram of the backbone torsion angle δ using 72 bins between −180 and 180°. Results corresponding to parmbsc0 simulations are drawn with lines and CHARMM27 ones with lines and points. Crystal values are shown as reference (dotted black line).

