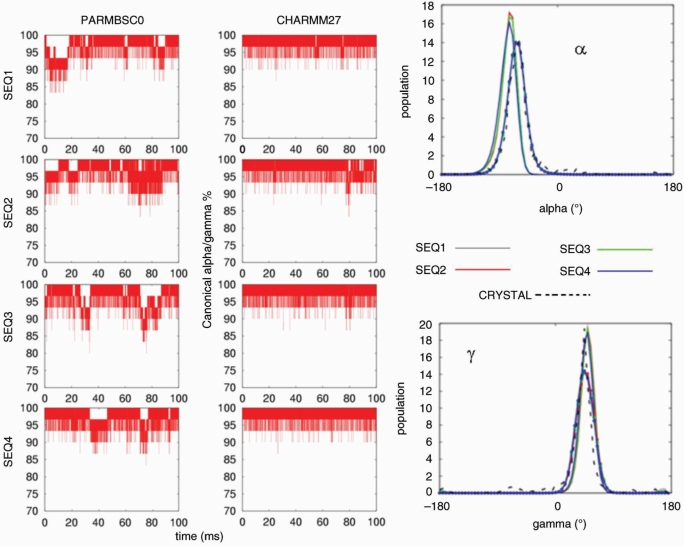
Figure 8.
Left: population (in percentage) of nucleotides in canonical α/γ conformations (g−/g+) for the four oligonucleotides in parmbsc0 and CHARMM27 simulations. Right: histograms of the associated alpha (α) and gamma (γ) dihedrals (in degrees). Results corresponding to parmbsc0 simulations are drawn with lines and CHARMM27 ones with lines and points. Crystal values are shown as reference (dotted black line). Histograms were made using 72 bins between −180 and 180°.

