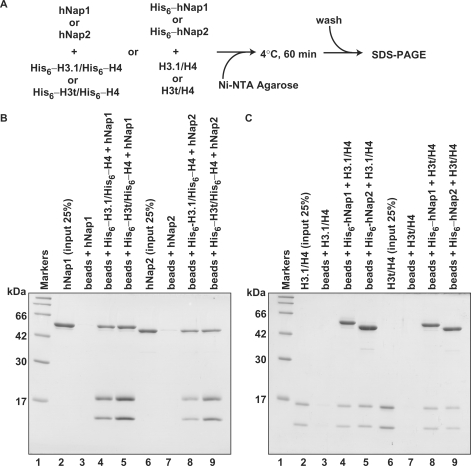
Figure 3.
The Ni-NTA-agarose pull-down assay. (A) A schematic diagram of the assay. (B) Pull-down assay using His6-tagged histones. hNap1 (lanes 3–5) or hNap2 (lanes 7–9) was mixed with His6-tagged H3.1/H4 (lanes 4 and 8) or His6-tagged H3t/H4 (lanes 5 and 9), and the proteins bound to the Ni-NTA agarose beads were analyzed by 15% SDS–PAGE with CBB staining. Lanes 2 and 6: the inputs (25%) of hNap1 and hNap2, respectively. (C) Pull-down assay using His6-tagged hNap1 and hNap2. H3.1/H4 (lanes 3–5) or H3t/H4 (lanes 7–9) was mixed with His6-tagged hNap1 (lanes 4 and 8) or His6-tagged hNap2 (lanes 5 and 9), and the proteins bound to the Ni-NTA agarose beads were analyzed by 15% SDS–PAGE with CBB staining. Lanes 2 and 6: the inputs (25%) of H3.1/H4 and H3t/H4, respectively.

