Figure 4.
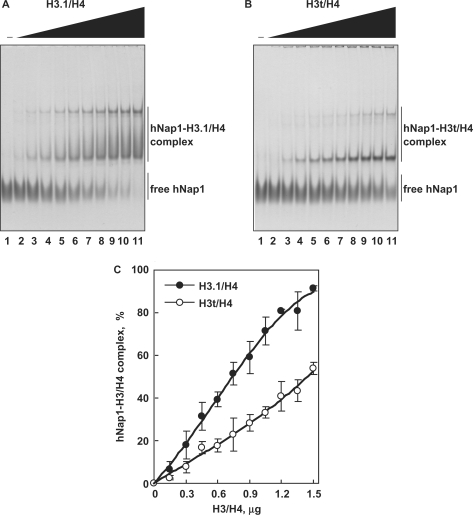
The gel mobility shift assay. (A) hNap1-H3.1/H4 complex formation. hNap1 (2.3 μg) was incubated with different amounts of H3.1/H4, and the hNAP1-H3.1/H4 complex was detected by non-denaturing 5% PAGE with CBB staining. The amounts of H3.1/H4 (μg) used in this study were: 0 (lane 1), 0.15 (lane 2), 0.3 (lane 3), 0.45 (lane 4), 0.6 (lane 5), 0.75 (lane 6), 0.9 (lane 7), 1.05 (lane 8), 1.2 (lane 9), 1.35 (lane 10) and 1.5 (lane 11). (B) hNap1-H3t/H4 complex formation. hNap1 (2.3 μg) was incubated with different amounts of H3t/H4, and the hNap1-H3t/H4 complex formation was analyzed as in (A). (C) Graphic representation of the hNap1-H3/H4complex formation. The relative amounts of hNap in the complex with H3.1/H4 (closed circles) and H3t/H4 (open circles) were plotted as the averages of three independent experiments, as in (A) and (B), with the SD values.

