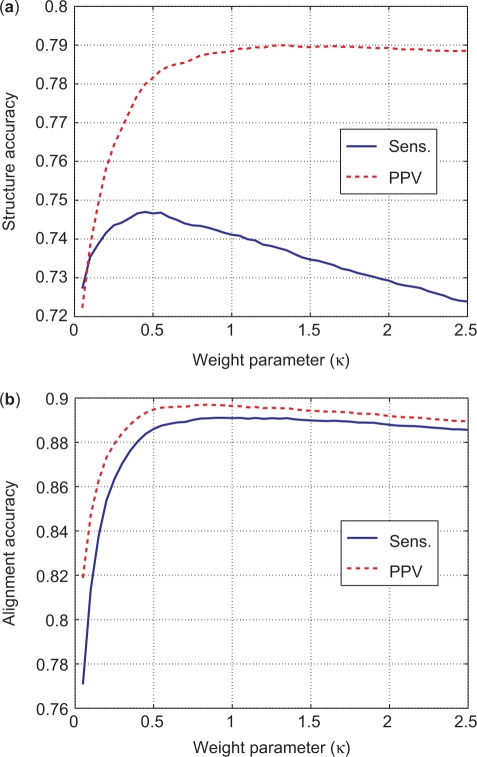
Figure 4.
Sensitivity and PPV of structure (a) and alignment (b) prediction as a function of the weight parameter κ. The prediction accuracy is averaged over a training data set of 1000 tRNA pairs from the Sprinzl Database (32) and 1000 5S rRNA pairs from 5S Ribosomal RNA Database (27). κ = 0.45 maximizes structure prediction sensitivity. Structure prediction PPV increases asymptotically with increasing κ. Alignment prediction sensitivity and PPV both decrease slowly for κ > 1.0.

