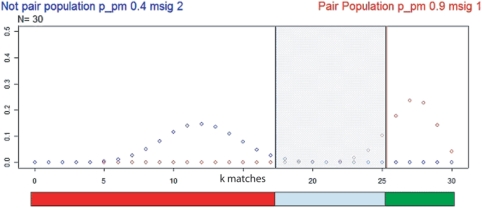
Figure 1.
Schematic illustration of probabilistic test settings. The figure shows the binomial distributions of real match pair population (red dots) and of non-pair population (blue dots) for N equal to 30 and PM and Pnon-M, for the real match pair population and the non-pair population, equal to 0.9 and 0.4. The red, blue and green bars define regions of ‘different’ (mnon-M set equal to 1), ‘uncertain’ and ‘similar’ (mM set equal to 2) SPIA test calls. The smaller the number of SNPs is, the narrower the region of uncertainty and the higher the probability of making an incorrect call.

