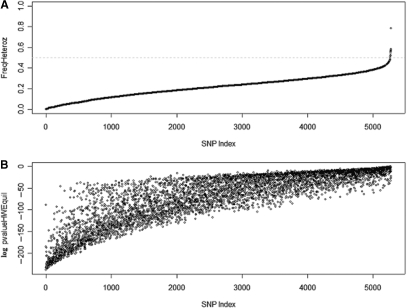
Figure 3.
Genotype characteristics of the filtered 5.3 K SNPs. We filtered the 50 K SNPs from the Affymetrix Xba chip ending with a set of about 5.3 K SNPs. Genotype characteristics were evaluated for this set of SNPs on a collection of 155 cell lines. Panels (A) and (B) show the heterozygosity frequency and the log of the p-value of the Hardy–Weinberg equilibrium test, respectively. In the context of identifying SNPs for the SPIA panel, we expect the best SNPs being the ones with minor allele frequency close to 0.5 and Heterozygosity frequency close to 0.5 (i.e. P-value Hardy–Weinberg = 1).

