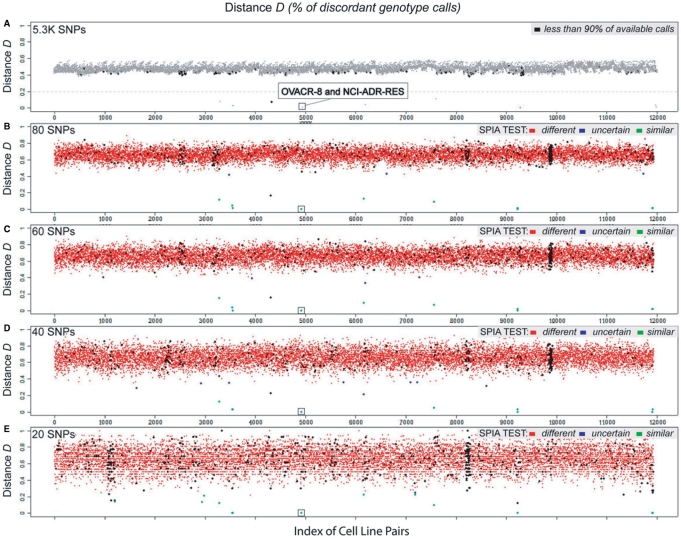
Figure 4.
Graphical representation of SPIA results on 155 cell lines: pair-wise distances and probabilistic test using SNP panels of different sizes. The number of possible combinations of pairs from a set of 155 samples is 11 935. Black dots represent distances were less than 90% of the genotype calls available. (A) The genotype distance was evaluated on the 5279 SNPs, which were filtered starting from the 50K SNPs represented on the Xba Affymentrix Array. The mean distance is 0.4736 and the standard deviation is 0.0358, accordingly to the confinement of almost all the evaluations. Dots below the dotted gray line represent pairs of cell lines which are genotypically very similar to each other (they share more than 80% of the 5279 loci here considered), suggesting that they share the same ancestral. (B)–(E) Multi-panel distances using 80, 60, 40 and 20 SNPs randomly sampled from the top 100 SNPs selected through the multi-step selection process. The mean distances are significantly higher respect to panel (A). The probability test was applied setting the match probability for the non-pair and for the matched pair population to 0.4 and 0.9 respectively and the parameter for the confidence level to 3 and 2 respectively. Red, blue and green dots indicate ‘different’, ‘uncertain’ and ‘similar’ test scores.

