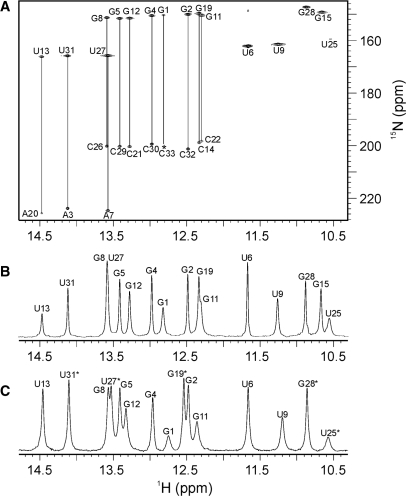
Figure 2.
(A) HNN-COSY spectrum of 33-nt RNA molecule showing A-U and G-C base pairs (indicated by vertical lines). A single cross-peak at a given 1H chemical shift indicates residue not involved in Watson–Crick base pair. Asterisk denotes the cross-peak of C33 with low intensity. (B) Imino proton region of 1D NMR spectrum of 33-nt RNA molecule. (C) Imino proton region of 1D NMR spectrum of the dimeric construct.

