
Figure 5.
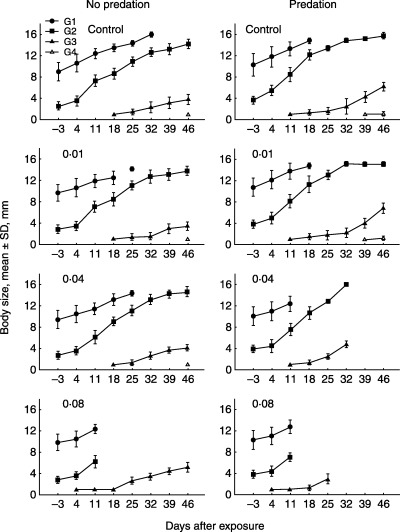
Mean body sizes of different generations (G1, G2, G3 and G4) of Artemia sp. before and after 1 h of exposure to esfenvalerate (control, 0·01, 0·04, 0·08 µg L−1) with and without simulated predation (mean ± SD, mm).
Official websites use .gov
A
.gov website belongs to an official
government organization in the United States.
Secure .gov websites use HTTPS
A lock (
) or https:// means you've safely
connected to the .gov website. Share sensitive
information only on official, secure websites.
Mean body sizes of different generations (G1, G2, G3 and G4) of Artemia sp. before and after 1 h of exposure to esfenvalerate (control, 0·01, 0·04, 0·08 µg L−1) with and without simulated predation (mean ± SD, mm).