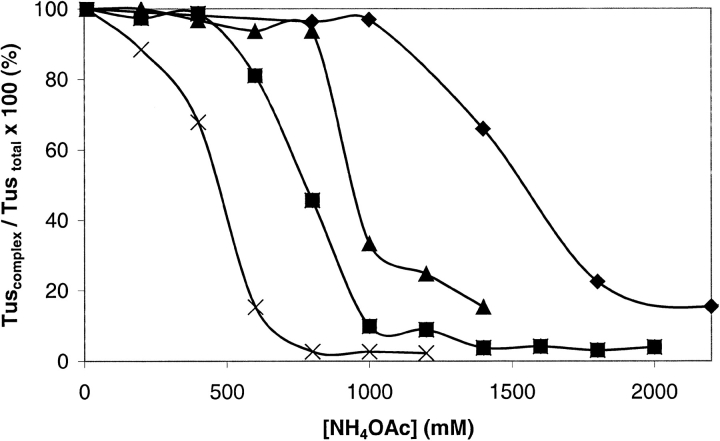
Fig. 6.
Stability of complexes of his6Tus and A173T with TerB and posn10TerB. The data show the decreasing amounts of his6Tus or A173T in the complex with dsDNA (Tuscomplex) as a percentage of the total amount of Tus (Tustotal), as a function of NH4OAc concentration. (diamonds) his6Tus–TerB, (triangles) his6Tus–posn10TerB, (squares) A173T–TerB, (multiplication symbols) A173T–posn10TerB.

