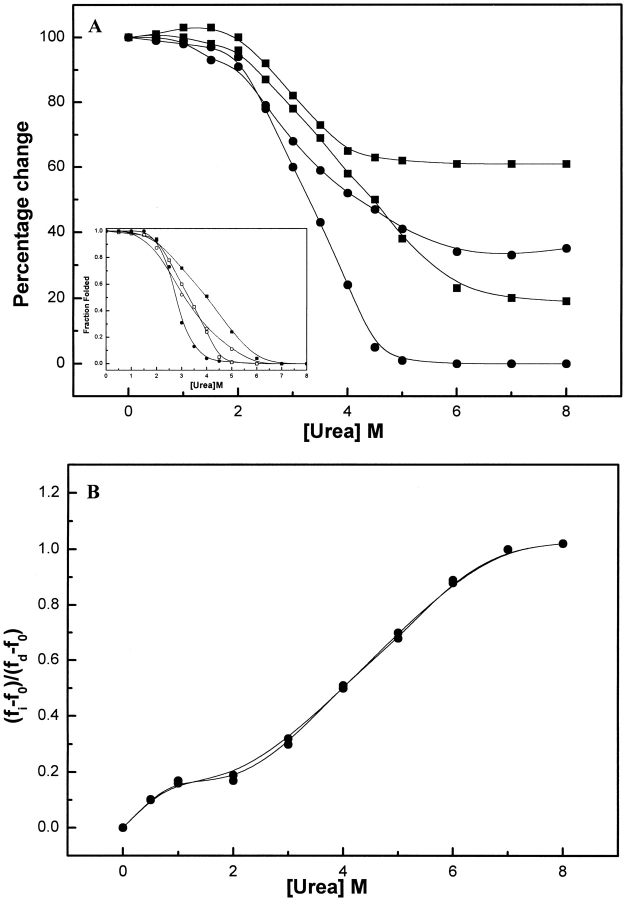
Fig. 4.
(A) Changes in enzymatic activity (filled circles), Soret absorption at 405nm (open squares), ANS fluorescence (open circles) and changes in ellipticity values at 222 nm (filled squares) of BLC with increasing concentrations of urea. The values corresponding to native BLC were taken as 100%. The measurements correspond to BLC concentration of 2 μM. Shown is the fractional folded population at increasing urea concentration as obtained from the data in main figure (inset). The symbols are same as in main figure. (B) Plot of the fractional change in the wavelength of maximum fluorescence emission of BLC, (fi−fo)/(fd−fo) versus urea concentration (details in Fig. 3A ▶). The open and filled circles represent data for native BLC at enzyme concentrations of 0.5 μM and 5 μM, respectively.

