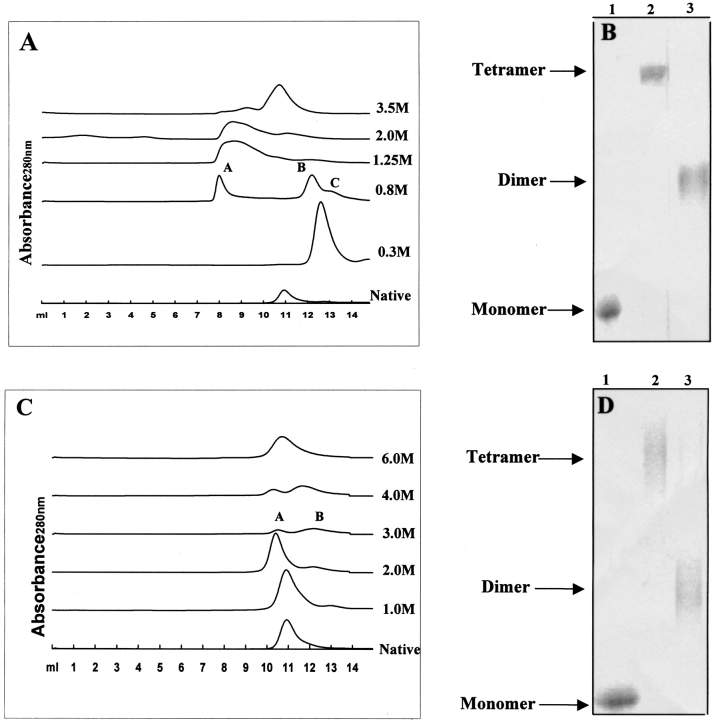
Fig. 5.
Chromatographic profiles of native BLC on a Superdex 200HR 10/30 column (manufacturer's exclusion limit 600 kD for proteins) on AKTA FPLC (Amersham Pharmacia Biotech, Sweden) at various guanidine hydrochloride concentrations (A) and urea concentrations (C) at 4°C. All the curves have been displaced along the Y-axis for display purposes. The panel (B) and (D) represent The SDS-PAGE profiles of glutaraldehyde crosslinked GdmCl-treated (B) and urea-treated BLC samples (D) follow. In B, lanes 1–3 represent native BLC, native crosslinked BLC, and 0.3M GdmCl-treated crosslinked BLC samples, respectively. In D, lanes 1–3 represent native BLC, crosslinked 2M urea-treated BLC, and crosslinked 3M urea-treated BLC, respectively. All experimental details are recorded in Materials and Methods.

