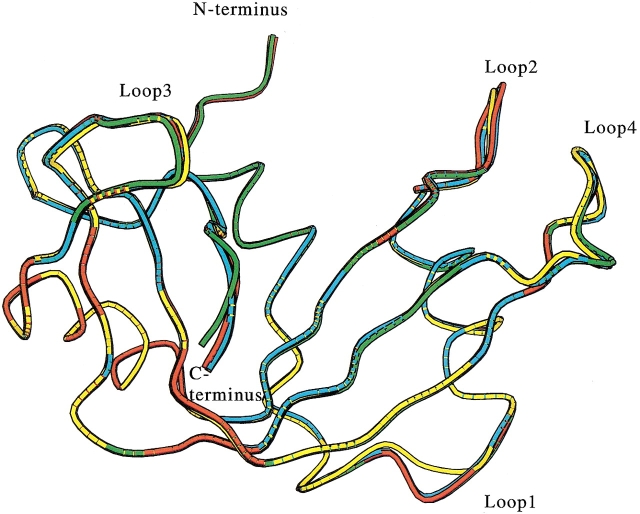
Fig. 1.
Superimposition of the backbone structures of wild-type and mutant RNase A. This figure was drawn with the MOLSCRIPT program (Kraulis 1991). Yellow, red, green, and cyan are wild-type, F120A, F120G, and F120W enzymes, respectively. Loops 1, 2, 3, and 4 represent the loop regions of 15–25, 34–41, 65–72, and 87–97, respectively.

