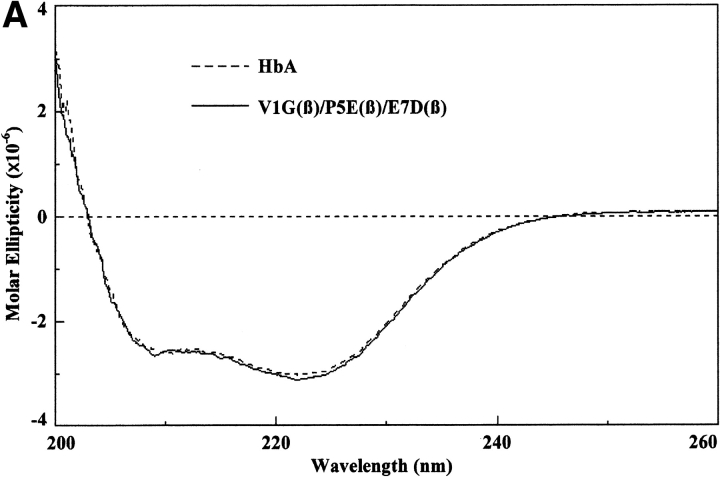
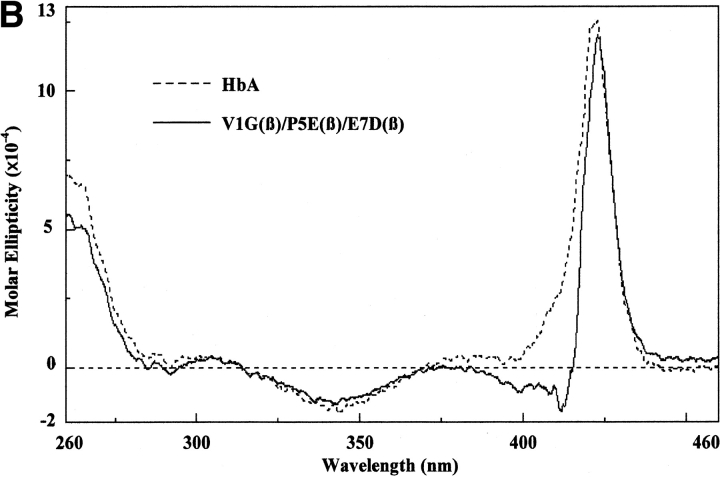
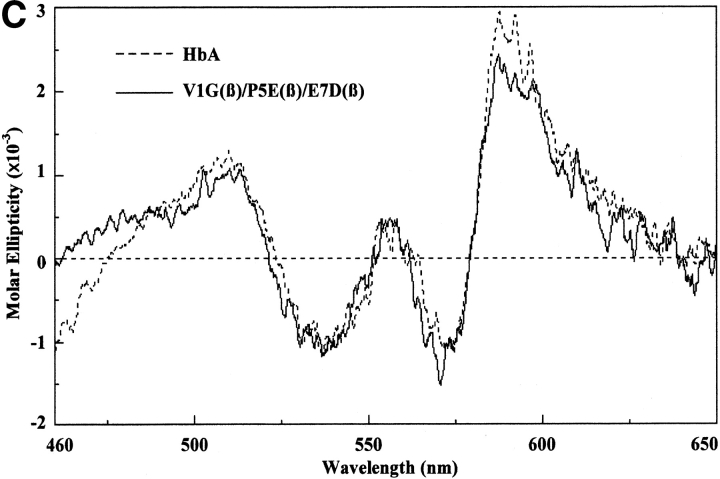
Fig. 2.
Circular dichroism spectra. The circular dichroism spectra were recorded as described in the text. For the far ultraviolet light region (A), the Hb concentration was 10 μM as tetramer, and a 0.1-cm curvette was used for four scans. For the near ultraviolet light region (B), the Hb concentration was 30 μM as tetramer, and a 0.1-cm cuvette was used for eight scans. For the visible region (C), the Hb concentration was 30 μM as tetramer, and a 1.0-cm cuvette was used for 16 scans. Molar ellipticity was calculated on a heme basis for which the A539 was used.


