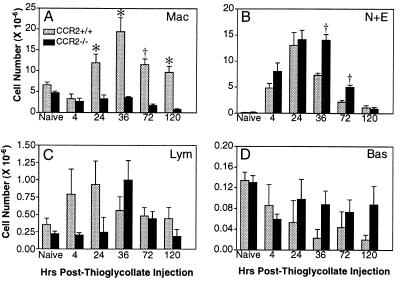
Figure 4.
Peritoneal leukocyte accumulation in CCR2+/+ mice (gray bars) and CCR2−/− mice (black bars) following thioglycollate injection. The number of each leukocyte type was determined on cytospin slides at the times indicated after thioglycollate injection: (A) Mac, macrophages; (B) N+E, neutrophils and eosinophils; (C) Lym, lymphocytes; (D) Bas, granulated basophils (n ≥ 5 CCR2+/+ and CCR2−/− animals at each time point. Data are presented as mean ± SEM; significant difference: ∗, P < 0.01; †, P < 0.001. Differences in C and D did not reach statistical significance.

