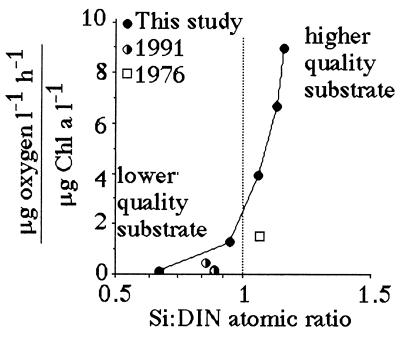
Figure 8.
The respiration rate per total Chl a concentration (μg oxygen per liter per h)/(μg Chl a per liter) in bottom water for three different studies vs. Si:DIN atomic ratio (±1 SE). The 1991 and 1976 data are from refs. 30 and 31, respectively; our study used different methods and surveyed a greater depth range. The data table for this figure appears as supplementary material on the PNAS web site (www.pnas.org).

