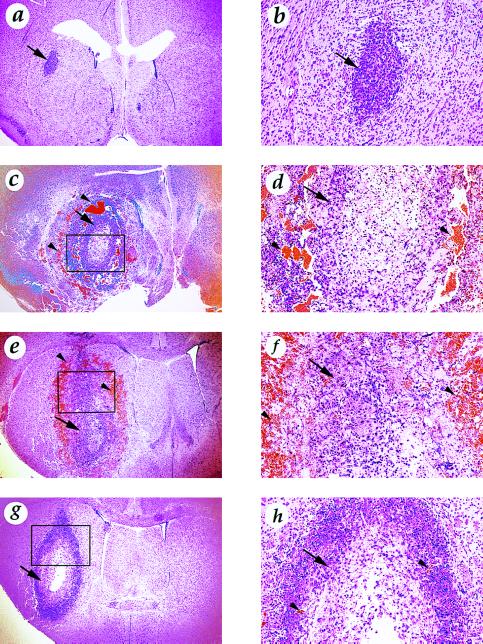
Figure 3.
Hematoxylin and eosin staining of mouse brains that received the parental U87MG or VEGF-overexpressing cells. (a and b) U87MG cells. (c and d) VEGF121-overexpressing cells. (e and f) VEGF165-overexpressing cells. (g and h) VEGF189-overexpressing cells. Original magnifications: a, c, e, and g, ×25; b, d, f, and h, ×100. d, f, and h are the enlarged pictures of the rectangular areas in c, e, and g, respectively. Arrows indicate tumor tissue and arrowheads indicate the blood cells. Experiments were carried out similarly to those shown in Fig. 2.

