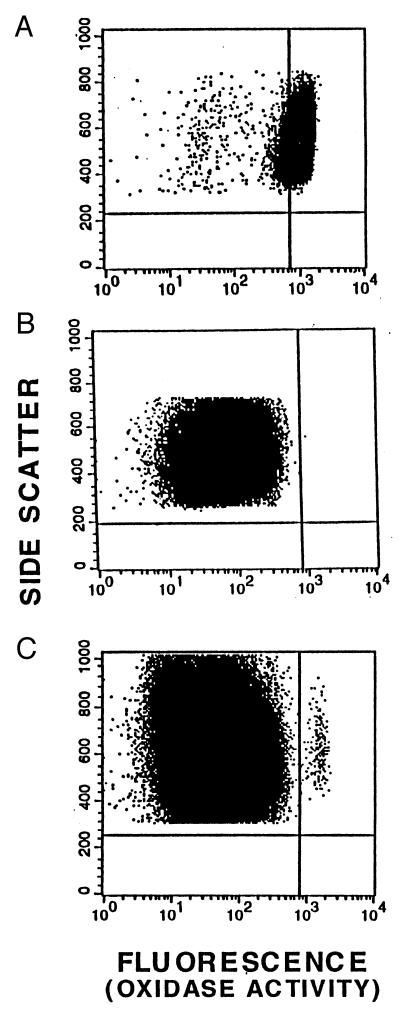
Figure 2.
Correction of neutrophil oxidase activity in vivo. These are dot plots of the flow cytometry DHR assays of oxidant production by PMA-stimulated peripheral blood granulocytes. Shown are analyses of granulocytes. (A) Normal volunteer. (B) Patient 1 before gene therapy. (C) Patient 1 at 24 days after gene therapy. Each event (dot) represents the analysis of parameters derived from a single cell. The data shown have been gated to include only events with the forward × side scatter characteristics of granulocytes. Data are plotted to evaluate fluorescence (x axis) as a measure of oxidase activity and side scatter (y axis) as a means of distinguishing individual granulocytes (events). The “positive threshold” vertical line is set so that 95% of stimulated normal granulocytes are to the right of that line in the region defined as oxidase positive.

