
Figure 2.
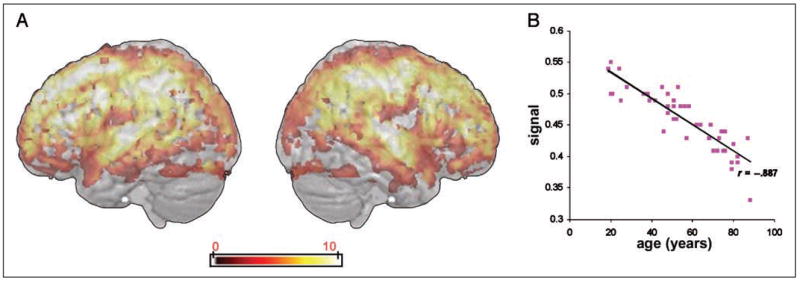
Areas of significant negative correlation between gray matter density across the whole brain and age in years. (A) Cortical areas where gray matter density correlates negatively with participant age are shown on a three-dimensional rendered spatially normalized brain. The color bar indicates the strength of correlation (voxel-level T values). (B) Scatterplot showing the relationship between mean gray matter density across the whole brain and age of participants in years.