
Figure 4.
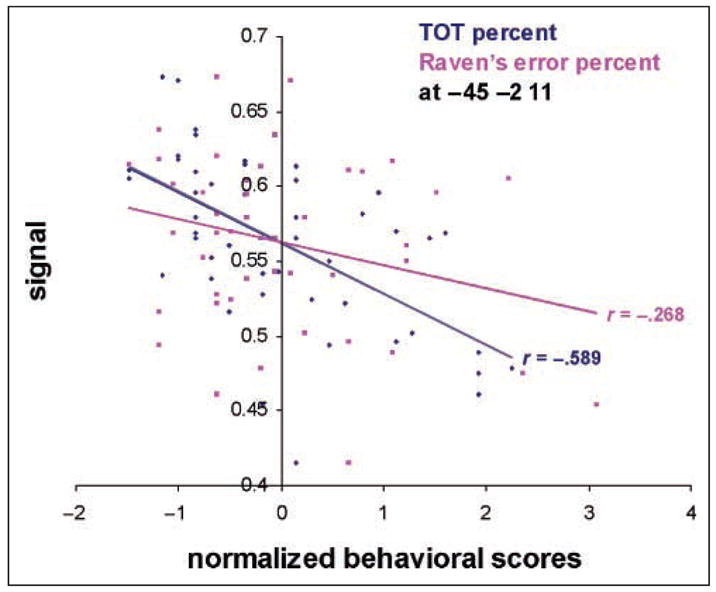
Scatterplot showing the relationship between gray matter density in the left insula and normalized TOT and RPM scores. Correlations are for the most significant voxel within the left insula (x = −45, y = −2, z = 11; Z-score = 4.33). A Williams (1959) test shows that the two correlations are statistically different, p < .05 (one-tailed).