Figure 2.

Estimates for the power law exponents (α) of the networks on the different levels. The bars show the confidence intervals with the 2.5% lower and 97.5% upper boundaries.

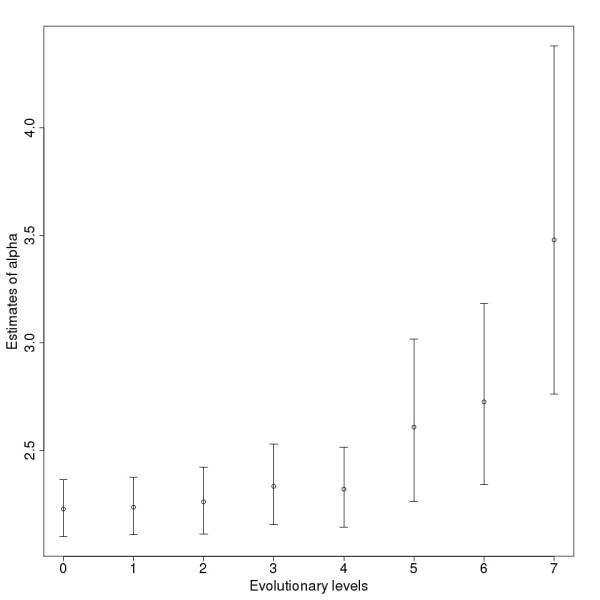
Estimates for the power law exponents (α) of the networks on the different levels. The bars show the confidence intervals with the 2.5% lower and 97.5% upper boundaries.