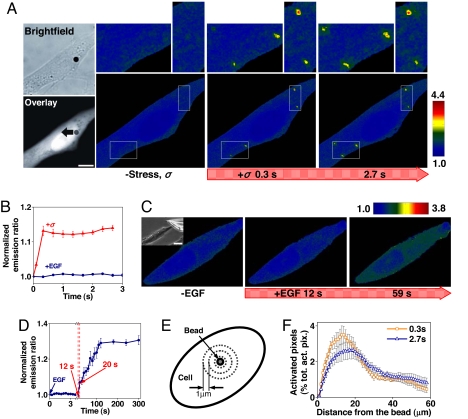
Fig. 1.
Rapid Src activation in response to localized mechanical stress. (A) A 4.5-μm RGD-coated ferromagnetic bead was attached to the apical surface of the cell (Left Upper, black dot is the bead) for 15 min to allow integrin clustering and formation of focal adhesions around the bead (38). Bead binding alone induced little Src activation (Fig. S9). The bead was magnetized horizontally and subjected to a vertical magnetic field (step function) that applies a mechanical stress σ (specific torque = 17.5 Pa) to the cell. A genetically encoded, CFP-YFP cytosolic Src reporter was transfected into the smooth muscle cells by following published procedures (7). The cytosolic Src reporter was uniformly distributed in the cytoplasm (Left Lower, YFP). The stress application induced rapid changes (<0.3 s) in FRET of the Src reporter at discrete, distant sites in the cytoplasm (see Insets) (focal plane is ≈1 μm above cell base), indicating rapid Src activation (Fig. S1). Images are scaled, and regions of large FRET changes (strong Src activity) are shown in red. The black arrow indicates bead movement direction. (Scale bar, 10 μm.) (B) Time course of normalized CFP/YFP emission ratio, an index of Src activation in response to mechanical or soluble growth factor EGF stimulation. n = 12 cells for +σ; n = 8 cells for +EGF. Error bars represent SEM. (C) Time course of CFP/YFP emission ratio in response to EGF in a representative cell (see Fig. S2 for full time course). EGF was locally released on top of the cell apical surface (<1 μm above) by using a micropipette (25 μm in diameter; top right of the Inset) (Scale bar, 20 μm) that was controlled by a micromanipulator and CellTram Vario. EGF (50 ng/ml) was released at a flow rate of 2 × 104 μm3/ms continuously for 5 min. Because the diffusion coefficient of a protein in water is ≈100 μm2/s (39), it takes ≈10 ms for EGF to reach the cell apical surface, and local EGF concentration at the cell apical surface is ≈40 ng/ml. (D) Time course of average Src activation from eight different cells after EGF treatment as in C. Error bars represent SEM. (E) Src activation at different cytoplasmic sites. At every 1 μm away from the bead, the emission ratio image after mechanical stimulation was compared pixel-by-pixel with that before mechanical stimulation. (F) The number of activated pixels (percentage of total activated pixels) at a given time versus distance from the bead after 0.3 s and 2.7 s of mechanical stimulation (see Fig. S4 with 90% threshold). Maximum number of Src activation was observed at ≈15 μm away from the bead. Note that the spatial distribution of Src activation but not the intensity of Src activation is summarized here. n = 8 cells. Error bars represent SEM.

