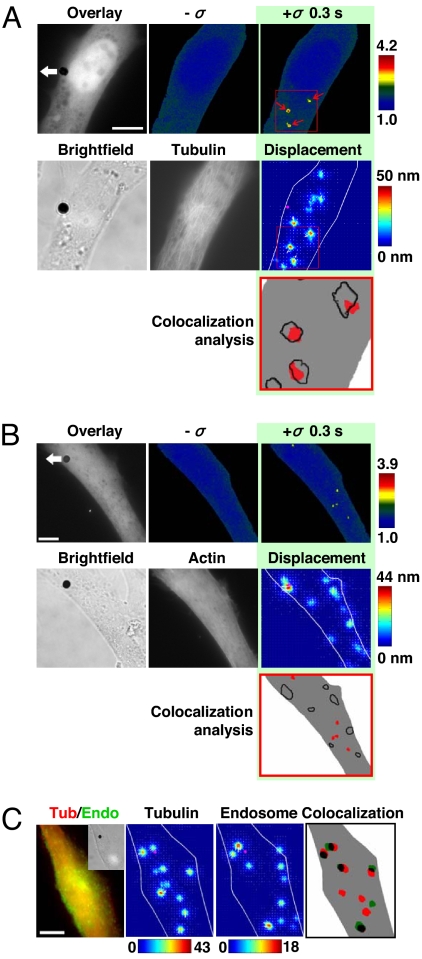
Fig. 3.
Rapid, long-range strong Src activation sites in the cytoplasm colocalize with sites of large microtubule displacements. (A) The cell was cotransfected with CFP-YFP Src reporter and mCherry-tubulin. A step function stress (17.5 Pa) was first applied for 3 s via an RGD-coated bead, and FRET changes were recorded. Then the microtubule deformation map was acquired when an oscillatory stress was applied for ≈30 s (0.3 Hz; peak stress = 24.5 Pa, equivalent to a constant stress of 17.5 Pa) (12). In this representative cell, strong Src activation sites coincide with large deformation sites (>15 nm) of microtubules in the same cell at the same focal plane (≈1 μm above cell base). The overlay image is the YFP Src reporter image superimposed with the bead. Pink circles indicate bead center position; white arrows represent microtubule deformation direction. Red arrows point to strong Src activation sites. In the colocalization analysis panel, red represents strong Src activation, and black lines represent large microtubule displacements. Three other different cells showed similar results. Of strong Src activation sites, ≈80% (15 of 19) were colocalized with sites of microtubule deformation >15 nm. (Scale bar, 10 μm.) (B) Src activation sites do not colocalize with F-actin deformation sites. The cell was cotransfected with CFP-YFP Src reporter and mCherry-actin. A step function stress (17.5 Pa) was first applied for 3 s via an RGD-coated bead, and FRET changes were recorded. Then the actin deformation map was acquired when an oscillatory stress was applied in the same way as in A. In contrast to A, strong Src activation sites do not coincide with large deformation sites (>15 nm) of actin in the same cell at the same focal plane (≈1 μm above cell base). Pink circles indicate bead center position; white arrows represent actin deformation direction. In the colocalization analysis panel, red represents strong Src activation, and black lines represent large actin displacements >15 nm. Five other different cells showed similar results. Of strong Src activation sites, only ≈12% (3 of 26) were colocalized with sites of actin deformation >15 nm. (Scale bar, 10 μm.) (C) Large microtubule deformation sites colocalize with endosomal membrane deformation in the same cell at the same focal plane (≈1 μm above cell base). The Inset is the bright-field image of the cell. The cell was cotransfected with mCherry-tubulin and pAcGFP1-endo (Left). The displacement maps of microtubule and endosome were acquired when an oscillatory stress was applied separately (30 s each) (peak stress = 24.5 Pa, frequency = 0.3 Hz). In the colocalization panel, red represents microtubule displacements >15 nm, green represents endosome displacements >8 nm, and overlapped black shows colocalization sites of microtubule and endosome. Of 13 large endosome displacement sites in three different cells, 10 were colocalized (≈80%) with large microtubule deformation sites. The color bar unit of the displacement map is in nanometers. (Scale bar, 10 μm.)

