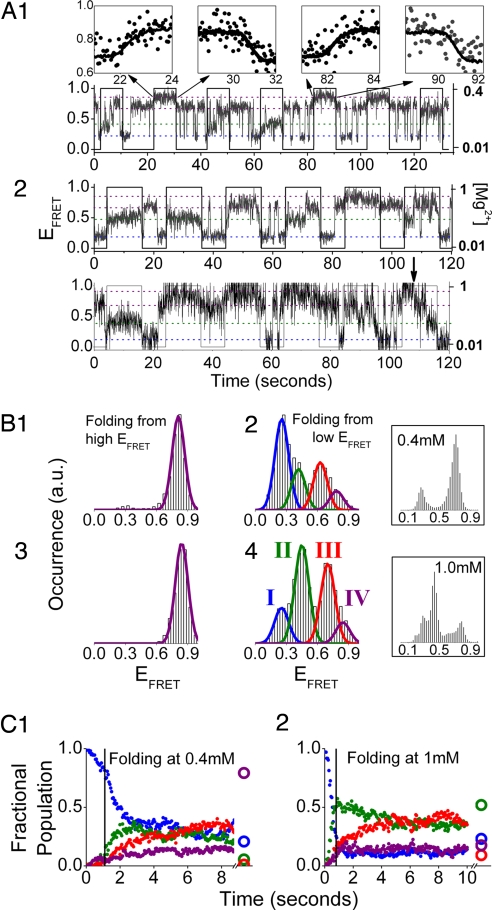
Fig. 3.
[Mg2+]-jump experiments for 0.01 ↔ 0.4 mM (A1, B1, B2, and C1) and 0.01 ↔ 1.0 mM (A2, B3, B4, and C2). (A) Representative single-molecule trajectories. (A1 Insets) Smooth EFRET change (dots) due to electrostatic relaxation overlap with the measured [Mg2+] profiles (solid lines). The last high [Mg2+] step of the lower trajectory in A2 shows a rarely observed transition (arrow) over the high barrier associated with the hidden DOF (Fig. 1B) whose signature is a transition from the state IV to state III. (B) Cumulative EFRET histograms for molecules folding from the high (B1 and B3) and low (B2 and B4) EFRET states. (Insets) Equilibrium EFRET histograms. Blue, state I; green, state II; red, state III; purple, state IV (state definition: ref. Table 1). (C) Population relaxation kinetics for molecules folding from the low EFRET state. Molecules starting from the high EFRET state only show occasional transitions to state III* and negligible transitions to other EFRET states (data not shown). Two-state behavior similar to that observed in the 0.01 ↔ 0.1 mM experiment (Figs. 2 B1, C1, and C2) is observed at the low [Mg2+] interval for these two jump conditions (data not shown).

