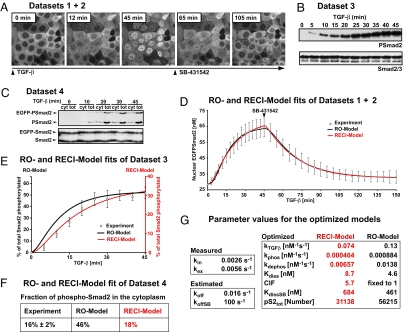
Fig. 2.
The RECI model is superior in fitting experimental datasets. (A) Live cell imaging in HaCaT EGFP-Smad2 cells in response to TGF-β and SB-431542 yielded Dataset 1 and Dataset 2, the kinetics of Smad2 nuclear accumulation and nuclear Smad2 clearance, respectively. Images of a subset of the sampled time course are shown. (B) Dataset 3. Kinetics of TGF-β-induced Smad2 phosphorylation. Representative immunoblots probed with anti-phospho-Smad2 and anti-Smad2/3 antibodies are shown. (C) Dataset 4. The nucleocytoplasmic distribution of total phospho-Smad2 immunoreactivity. Cytoplasmic (cyt) and total extracts (tot) were immunoblotted as in B. Double amounts of cytoplasmic extracts were loaded compared with total cell extracts. (D) Both models fit the average nuclear accumulation and average nuclear clearance data equally well. Images as in A were analyzed by measuring nuclear fluorescence (○; ± SD, n = 10 cells). The black line is the RO model fit, and the red line is RECI model fit. (E) Experimental phosphorylation data from immunoblots as shown in B (○; ± SD, n = 3). The black line and black ordinate indicate RO model fit. The red line and red ordinate indicate RECI model fit. The RECI model is superior in fitting the phosphorylation data and predicts a lesser extent of Smad2 phosphorylation. (F) Quantification of the levels of phosphorylated EGFP-Smad2 and endogenous Smad2 in the cytoplasm at maximal response to TGF-β derived from experiments like those shown in C compared with the predicted levels from the RO and RECI models. In contradiction to the experimental value, the RO model predicts high levels of cytoplasmic phospho-Smad2. The RECI model agrees well with the experimental value. (G) The best-fit parameter sets for the RECI and RO models. For a detailed description see SI Text.

