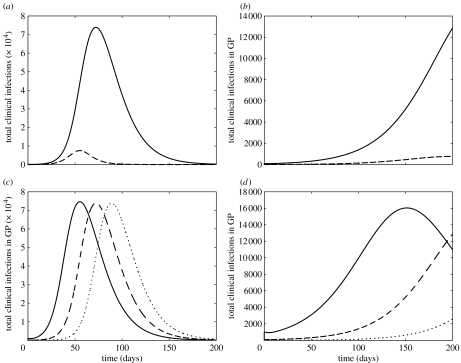
Figure 2.
The time courses of the total clinical infections in the GP (solid curves) and HCWs (dashed curves) with 30 and 45% attack rates, respectively, are illustrated in the following: (a) without prophylaxis of HCWs and (b) with 100% prophylaxis coverage of HCWs and 30% reduction in susceptibility due to prophylaxis (αS=0.3). An initial number of I(0)=100 infectives in the GP was assumed in (a) and (b). The time courses of the total clinical infections in the GP with different initial values of infectives are illustrated in the following: (c) without prophylaxis and (d) with 100% prophylaxis coverage of HCWs. The initial values of infectives are as follows: dotted curves, I(0)=10; dashed curves, I(0)=100; solid curves, I(0)=1000.

