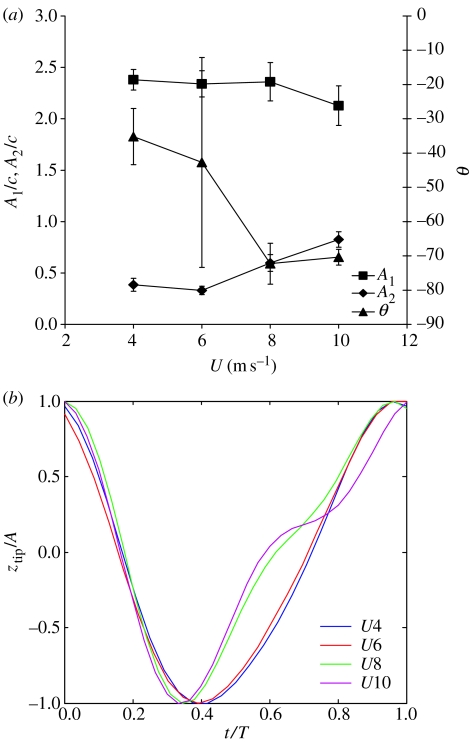
Figure 3.
(a) The amplitude, A, and phase difference, θ, between the fundamental and the first harmonic frequencies of the wingtip trace. A1 and A2 are the real-valued magnitudes of complex coefficients Z1 and Z2. Values are mean±s.d. Number of sequences analysed for the different speeds are 2, 4, 5 and 5, respectively. (b) Wing trace reconstructions based only on the coefficients shown in (a).

