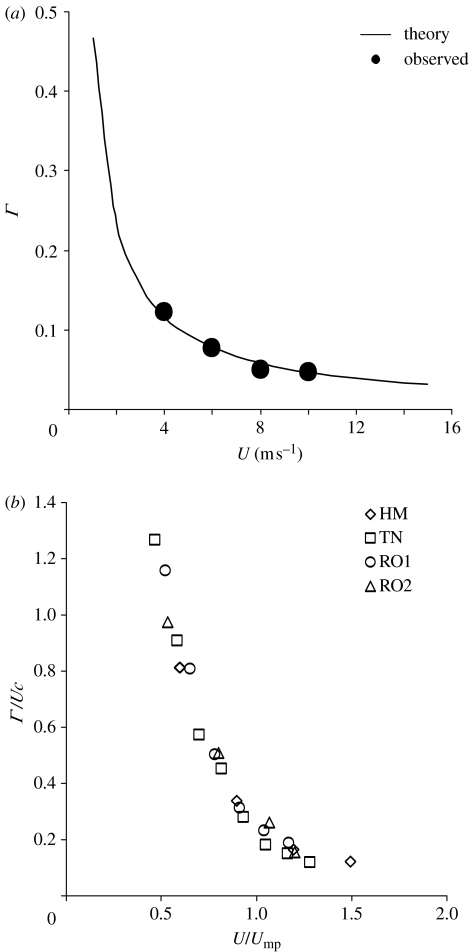
Figure 9.
(a) Circulation, Γ, of the strongest start (+) vortex as a function of flight speed, U, for the house martin. The theoretical curve is from equation (4.5). (b) Comparison of normalized circulations for the house martin (HM; this study), robin (RO1 and 2; Hedenström et al. 2006) and thrush nightingale (TN; Spedding et al. 2003a).

