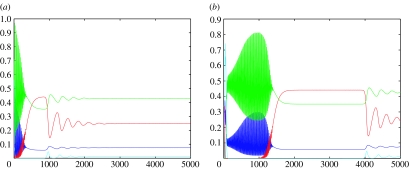
Figure 1.
Plots of the numerical solutions to equations (2.3a–d) for two different sets of initial conditions and parameter values s1=0.85, s2=0.6, s3=0.7, s4=0.88, ρi=2.5, ν=0.17, γ=0.16, μi=0.2, c1=0.9, c2=0.2, c3=0.4 and c4=0.35. The plots show how the length of time that the initial transient dynamics are present for varies with initial conditions. In figure (a), the initial conditions are (0.1; 0.1; 0.5; 0.5). In figure (b), the initial conditions are (0.0001; 0.339; 0.0001; 0.338) and the system is run for 5000 time-steps in each case. The fixed point of coexistence is (0.074; 0.248; 0.428; 0.010) and is a stable spiral. The blue line represents uninfected hosts; the red line infected hosts, green line P1 and the cyan line P2.

