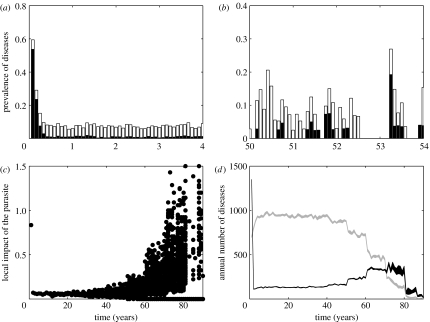
Figure 3.
Emergence of the severe form of the disease with fragmentation: (a) an example of prevalence of each form of the disease (white, mild and black, severe) during the first 4 years of the simulation in a subpopulation; (b) as for (a) but after 50 years of the simulation; (c) index of the local impact of the disease defined as the total number of individuals that died from the disease during a given year in a given subpopulation divided by the mean size of the subpopulation during that year. Each point represents one subpopulation for one replicate. Thus for each year, we have N(t)×10 points. In fact, as the time progresses, more points are at 0 and cannot be distinguished from each other; (d) estimation of the mean number of individuals in the entire metapopulation that develop each form of the disease (grey, mild and black, severe) during a given year with 95% confidence intervals.

