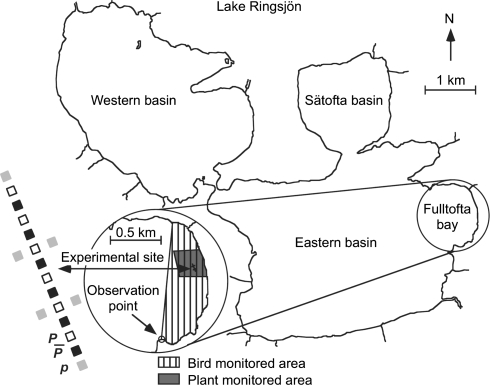
Fig. 2.
Map of Lake Ringsjön with an enlargement of Fulltofta Bay and an overview of the bird-monitored and plant-monitored areas as well as the plant-experimental site. Enlargement of the plant-experimental site shows the six replicates of three treatments, with gray squares representing plots where no P. perfoliatus was planted and no protection from waterbirds was provided until 18 December 2000 at which time all treatments were covered with metal nets on the bottom (treatment p). Black squares represent plots with planted P. perfoliatus that were continuously protected by nets (treatment
 ). White squares represent plots with planted P. perfoliatus that were unprotected from 8 August to 18 December 2000 (treatment P)

