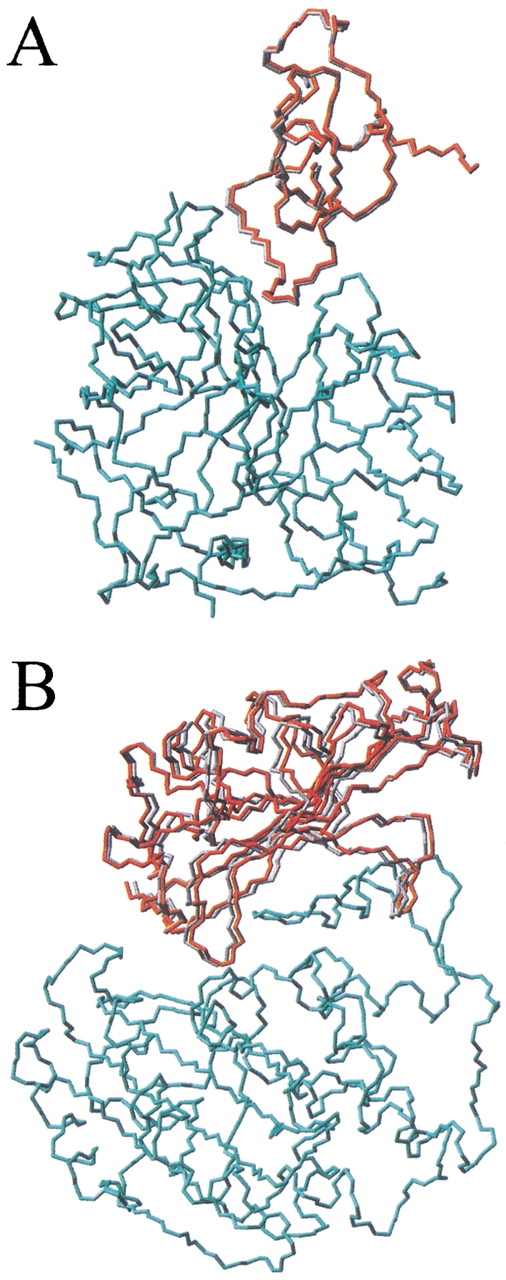
Fig. 2.

Representation of the near-native solutions obtained after redocking complexed subunits: (A) 1cho; root mean square deviation (RMSD), 0.3 Å; and (B) TEM1; RMSD, 1.3 Å. In red is represented the predicted ligand molecule, compared with the real structure (in gray). Only the receptor Cα atoms (in cyan) are optimally superimposed onto the corresponding atoms of the real complex. For clarity, only backbone atoms (nitrogen, Cα, and carbonyl carbon) are shown.
