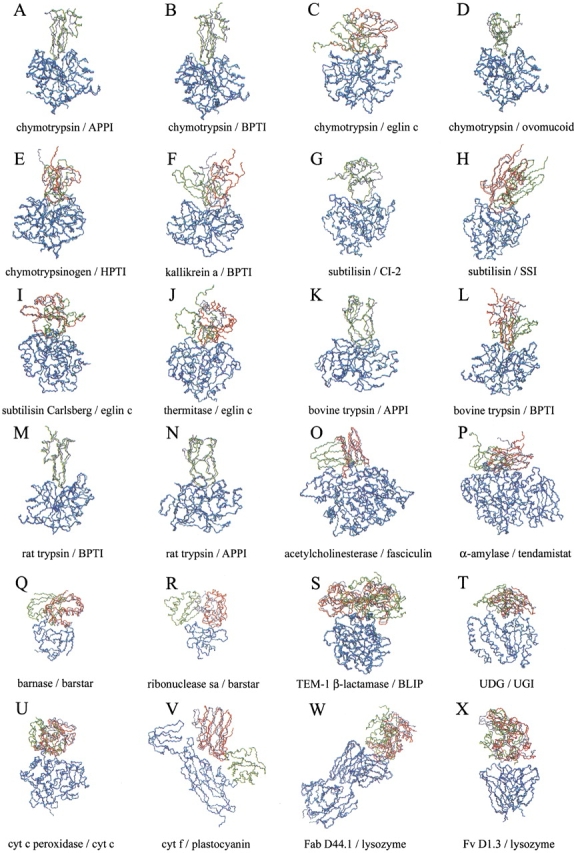
Fig. 3.

Representation of the near-native (in red) and lowest energy (in green) solutions after docking unbound subunits and further refinement of the ligand interface side-chains. For those complexes in which the near-native conformation was the lowest energy solution, only the latter is represented (in green). The real ligand structure is represented (in gray) for comparison. Only the receptor Cα atoms (in blue) are optimally superimposed onto the corresponding atoms of the real complex (in cyan). For clarity, only backbone atoms (nitrogen, Cα, and carbonyl carbon) are shown. The root mean square deviation (RMSD) of the near-native predicted structure respect to the real complex (calculated for the ligand interface Cα atoms when the receptor is optimally superimposed onto the real one) is indicated. (A) 1ca0, RMSD 1.2 Å; RANK 1; (B) 1cbw, RMSD 0.7 Å; RANK 1; (C) 1acb, RMSD 4.3 Å; RANK 102; (D) 1cho, RMSD 1.0 Å; RANK 1; (E) 1cgi, RMSD 3.1 Å; RANK 12; (F) 2kai, RMSD 5.5 Å; RANK 2; (G) 2sni, RMSD 2.9 Å; RANK 1; (H) 2sic, RMSD 1.9 Å; RANK 7; (I) 1cse, RMSD 2.5 Å; RANK 40; (J) 2tec, RMSD 8.1 Å; RANK 146; (K) 1taw, RMSD 2.9 Å; RANK 1; (L) 2ptc, RMSD 2.0 Å; RANK 3; (M) 3tgi, RMSD 0.8 Å; RANK 1; (N) 1brc, RMSD 1.8 Å; RANK 1; (O) 1fss, RMSD 1.7 Å; RANK 7; (P) 1bvn, RMSD 5.0 Å; RANK 7; (Q) 1bgs, RMSD 4.2 Å; RANK 212; (R) 1ay7, RMSD 6.2 Å; RANK 156; (S) TEM1, RMSD 3.1 Å; RANK 12; (T) 1ugh, RMSD 4.8 Å; RANK 9; (U) 2pcb, RMSD 3.2 Å; RANK 46; (V) 2pcf, RMSD 5.2 Å; RANK 9; (W) 1mlc, RMSD 5.1 Å; RANK 16; and (X) 1vfb, RMSD 3.1 Å; RANK 75. Complexes 1acb, 1cse, 2tec, and 1vfb present ligand backbone deformation on binding (RMSD of the unbound ligand backbone atoms in the interface >1.8 Å with respect to the complexed structure, after optimal superimposition of all ligand Cα atoms), so the indicated RMSD values for them may not reflect the accuracy of the predicted near-native conformations.
