
Fig. 5.
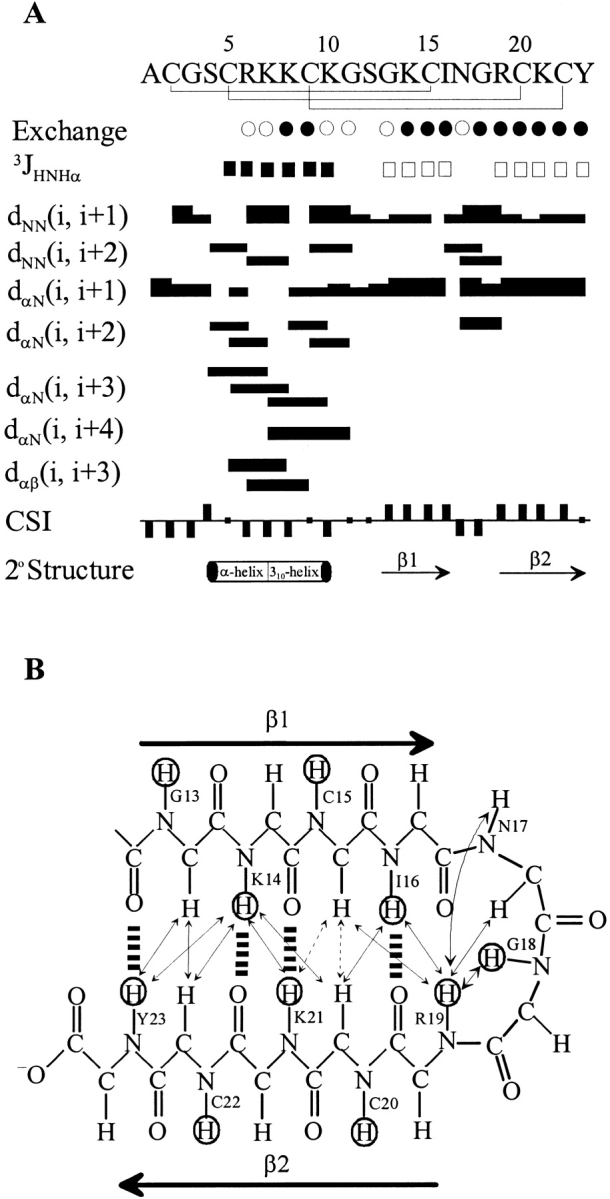
(A) Summary of the amide proton exchange rates, 3JNHα-coupling constants, NOE connectivities, CαH chemical shift index, and the derived secondary structures. Medium-exchange (<3.5 h; open circles) and slow-exchange (>24 h; filled circles) amide protons. 3JNHα coupling constants are <6 Hz (filled squares) and >8 Hz (open squares). Bar thickness indicates the intensity of NOE connectivity, with thicker bars representing stronger NOEs. Negative bars in the chemical shift index indicate upfield shifts of >0.1 ppm of the CαH proton compared with the expected random-coil CαH proton chemical shift. Positive bars indicate downfield shifts of >0.1 ppm of the CαH proton compared with the expected random-coil CαH value. The derived secondary structures based on NMR parameters as described above are shown (bottom). (B) Definition of the β-sheet structure of Tc1 is shown based on the NOEs and amide proton exchange rate. Cross-over NOEs between β-strands are shown in double arrows. Ambiguous cross-over NOEs, because of resonance overlap, are indicated in double arrows with a dashed line. Dashed lines between backbone amide protons and backbone carbonyl oxygens indicate hydrogen bonds consistent with slow-exchanging HN observed in D2O. The amide protons with slow exchange rates are circled.